The wide variety of statistical nuance around baseball today, with different websites measuring performance amongst various categories in different ways, can confuse anyone, and it’s challenging to know which stats are most relevant. Batting averages, on-base percentage, and slugging percentage only tell so much, and with that in mind, we’ve devised a list of those stats that are most relevant to assessing how well a player is performing.
Today, baseball fans are bombarded with an ever-increasing landscape of statistical numbers from FanGraphs, Baseball-Reference, Baseball Prospectus, Trumedia, and Baseball Savant that can make it difficult to understand a player’s contribution on the field entirely. With various ways of calculating a player’s value, even between sites, we could simplify this process so you can decide which metrics most apply to how you view baseball. Here is a glossary of all the baseball terminology you need to know for your baseball journey, the knowledge you may want to know, and the background pieces that are simply cool to understand, from a breakdown of the different ways websites calculate Wins Above Replacement (WAR) to, the hitting stats to pay attention to and how much defensive value a player can have.
Table of Contents
- What are WAR (Wins Above Replacement) and WARP (Wins Above Replacement Player)?
- How Baseball-Reference WAR And FanGraphs WAR Are Calculated
- Why does WARP differ so much from FanGraphs and Baseball-Reference?
- Which site (FanGraphs, Baseball-Reference, or Baseball Prospectus) is Superior with WAR?
- Offensive Statistics
- Pitching Statistics
- Fielding Statistics
- Catcher Statistics
What are WAR (Wins Above Replacement) and WARP (Wins Above Replacement Player)?
WAR is critiqued and analyzed more than any other stat in baseball, if only because different organizations in the form of Baseball Prospectus, FanGraphs, and Baseball-Reference create versions that interpret it differently. It’s one of the most complex statistics provided by the sabermetric era, but it needs to be as it attempts to bring every player’s contribution down to one single number. Wins above replacement is a statistic that explains how much better a player is than your average replacement-level player, not the average performance level in the major leagues, which is important to note as we go forward.
So, for example, last season, per Baseball-Reference’s algorithm, Shohei Ohtani was worth 10 wins more than if the Angels had brought up a standard player from their minor league affiliate in Triple-A to take his place. To put this in perspective, a team of entirely replacement-level players would be expected to win around 41-50 games in a 162-game season.
WAR captures various elements, such as a player’s position on the field, their fielding, hitting, and pitching performance, their speed on the basepaths, and everything else they can or can’t do on the field, to come up with one metric that describes their entire performance. One of the best things about this statistic is how you can accumulate WAR in various ways, from being a defensive stud in a key position to dominating from the pitching mound or hitting monstrous home runs day after day.
Wins Above Replacement is not an entirely accurate statistic in the form of saying that a player with 4.5 WAR is definitely better than a player with 4.2 WAR. Still, by providing ranges, we can better group players to discuss their value. That said, a 6.5 WAR player compared with a 4.2 WAR player gives you confidence that the former had the better season and was more valuable, WAR becomes an incredibly useful metric.
Ranges of Value in WAR
0-1 WAR – Usually, the contribution of a bench player or relief pitcher
2-3 WAR – An average full-time position player or starting pitcher at the major league level
4-6 WAR – An All-Star caliber player
7+ WAR – An MVP candidate
As mentioned earlier, each website comes to a final value slightly differently. If we take Corey Seager as an example, he was awarded:
- 6.9 WAR from Baseball-Reference
- 6.1 WAR from FanGraphs
- 4.7 WARP from Baseball Prospectus
Each baseball standard puts different values based on different hitting, pitching, and fielding statistics that cause these differences, some of which you may agree with more than others. So, let’s get into it:
How Baseball-Reference WAR And FanGraphs WAR Are Calculated
- Baseball-Reference uses pitching runs allowed (all runs, not just the “earned” ones). In contrast, FanGraphs uses a stat called Fielder Independent Pitching (FIP), which is calculated based on a pitcher’s walks, home runs, and strikeouts, eliminating fielder involvement. As a result, Baseball-Reference tends to value pitching more than FanGraphs, especially those who don’t lean solely on strikeouts and walks and instead use weak contact and their defense to get hitters out.
- The hitting and base running metrics are generally very similar, so there isn’t much difference in the result. Both use a derivative of WOBA called “weighted runs above average.”
- Baseball-Reference uses Defensive Runs Saved (DRS) for defensive WAR, whereas FanGraphs uses ultimate zone rating (UZR). UZR is considered slightly superior, given that it’s based more on long-term averages. In contrast, DRS has a more aggressive scoring system, which doesn’t take shifts into account and instead assumes where defenders should be situated. This means a shifted second baseman will be penalized if a ball goes through the second base gap.
In summary, there isn’t a whole lot of difference between how both sites calculate their respective wins above replacement. However, a slight majority would prefer Baseball-Reference, especially in regards to pitching numbers, where “runs allowed” seems a better base to start with than Fielder Independent Pitching (FIP) and encompasses more qualities involved in pitching, although it does then favor pitchers on better defensive teams.
Why does WARP differ so much from FanGraphs and Baseball-Reference?
Baseball Prospectus differs more than the two more common metrics as they attempt to refine some of the base stats.
- Instead of using “runs allowed” for pitching like Baseball-Reference, they use “Deserved Run Average” (DRA), which focuses on a pitcher’s expected contribution more than their actual results. This takes the ballpark, defense, and quality of the opponent out of the equation.
- Defensively, they are based around Fielding Runs Above Average (FRAA), which uses less zone-based coverage analytics and instead focuses on plays made compared to the league average. This includes information on the base situation, batter handedness, ground ball tendencies of the hitter, etc., essentially stepping back and saying, “Did the fielder make the play?” as the crux of their calculations.
- BP uses Deserved Runs Created (DRC+), which grades hitters based on their expected contribution in each given situation. It attempts to delve beneath surface stats and see how much credit should be given to the hitter for each play depending on context (such as park factors and opposition).
- Baseball Prospectus WARP also attempts to clarify what outcomes are affected by an individual in isolation compared to other players; for example, Shohei Ohtani would gain less differential for hitting a home run against Lance Lynn in a blowout than if he hit a walk-off home run against Gerrit Cole.
Which site (FanGraphs, Baseball-Reference, or Baseball Prospectus) is Superior with WAR?
Ultimately, this comes down to personal preference as to how you view the stats that make up WAR for each individual site. It could be that you like how Baseball Prospectus considers situational baseball more, how Baseball-Reference ranks pitchers, or how FanGraphs assesses fielders. Ultimately, an amalgamation of all three and their rankings will give you a good idea of how valuable a player is over an entire season.
Most people look towards Baseball-Reference and FanGraphs first, but that could result from being earlier into the WAR sweepstakes than Prospectus. Remember that a debate over how you see players is fun because it’s a debate, and everyone can have their own opinions. These WAR calculations are not infallible, and they show how differently even computers can see things on the field.
Offensive Statistics
Table of Contents (click to jump to individual statistic)
- Batting Average
- Slugging Percentage
- On-Base Percentage
- On-Base Plus Slugging (OPS)
- Stolen Bases
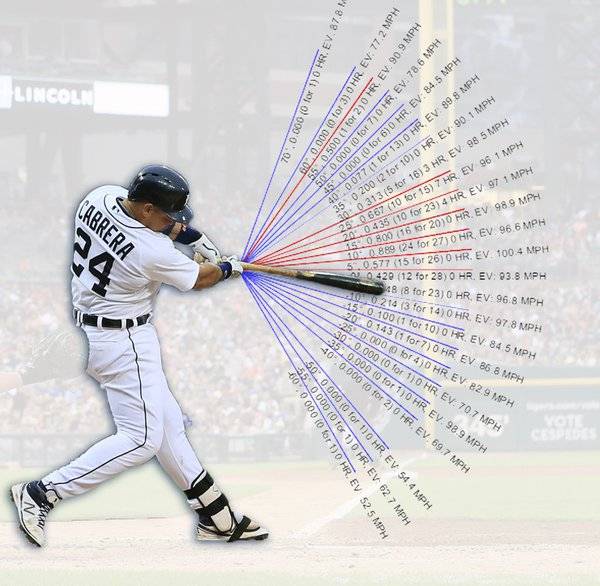
- Hard Hite Rate & Average Exit Velocity
- Sweet Spot Rate
- Barrel Percentage
- Weighted On-Base Average (wOBA)
- Whiff Rate
- Chase Rate
- Barrel Percentage
- Weighted On-Base Average (wOBA)
- Expected Statistics (xBA, xSLG, xWOBA, etc)
- Strikeout Percentage
- Walk Percentage
- Ground Ball Rate
- OPS+ & wRC+
- Other Stats
Scoring runs can be done in various ways on a Baseball field, using various skills of athleticism, intelligence, and technical excellence. While the hitting portion is the most vital of the mix, base running instincts and intelligence can factor into close games, as can game awareness of what your team needs in each specific at-bat. As such, we can calculate a player’s offensive contribution in many ways.
The Basic Stats
What Is Batting Average (BA)?
An old-school metric, batting average, assesses how often a hitter is projected to get on base per at-bat (to the thousandth digit). A .326 batting average estimates that a hitter will hit his way on base 326 times over a 1000-at-bat sample size.
It used to be that anyone who hit .300 was considered an above-average hitter in MLB. However, that number has become more the possession of the elite in recent seasons. In the 2000s, baseball averaged 39.7 hitters above the .300 mark per year; in the 2010s, this dropped to 22.1, and in 2023, the mark was just… nine. Hitters averaged just .248 as a whole on the season, with the decrease arising largely as a result of drastic improvements in the quality of pitchers with their ever-increasing velocity and movement, which in turn led to organizations searching for the powerful, extra-base hitting approach at the plate to take advantage of pitcher mistakes.
Ranges
Elite – .300+
Excellent – .280 to .299
Above average – .255 to .279
Average – .235 to .254
Below average – .210 to .234
Poor – Below .210
Batting average still has its merits in assessing a hitter’s value. Still, luck can influence it in terms of where the ball gets hit and doesn’t necessarily drive in or create the same runs if a hitter doesn’t have the power to hit extra bases regularly. That being said, Luis Arraez had a throwback performance compared to previous eras, lending hope that hitting for average alone will still be a point of variety for MLB players moving forward. By recording a high average, his OPS (I’ll explain this briefly) was .861, giving him 4.9 Wins Above Replacement (or WAR, also getting to this shortly) on the season. In short, batting average still adds significant value to a team.
2023 MLB League Leaders
.354 Luis Arraez
.337 Ronald Acuna Jr
.331 Freddie Freeman
.330 Handy Diaz
.327 Corey Seager
Strongly Linked Background Stats – Sweet Spot Percentage, Hard Hit Rate, Strikeout Rate
What is Slugging Percentage (SLG)?
Slugging percentage assesses a batter’s ability to notch extra-base hits (i.e., doubles, triples, and big booming home runs). The formula is:
(total singles+(2*total doubles)+(3*total triples)+(4*total home runs)/total at-bats
Slugging percentage is affected by batting average, in that a higher batting average gives you a higher base for your slugging percentage, and has led to some spin-off statistics such as ISO (isolated power, which we’ll come to in a bit) to work out just how regularly a hitter obtains extra bases. Organizations have heavily dialed in on this as a way to drive in runs without needing three or four singles in an inning, which has become extraordinarily difficult to do.
When you reach second base, you are usually just one single away from scoring. Home runs are great ways to put up big innings that can decide a game with a single blow, so slugging is a useful tool for assessing a hitter’s effectiveness throughout the year. Slugging percentage is also a big part of the OPS measure, which is widely used as a total measure of a hitter’s performance.
Ranges
Elite – .520 +
Excellent – .480 to .520
Good – .440 to .479
Average – .390 to .439
Below Average – .360 to .389
Poor – Below .360
The league average slugging percentage in 2023 was .414, yet the truly elite separate themselves from the pack in this statistic. Here are the top qualified sluggers for 2023:
2023 MLB League Leaders
Shohei Ohtani – .654
Corey Seager – .623
Matt Olson – .604
Ronald Acuna Jr – .596
Mookie Betts – .579
Strongly Linked Background Stats – Average Exit Velocity, Barrel Rate, Hard Hit Rate
What is On-Base Percentage (OBP)?
This is a marker for how often a player gets on base per plate appearance (note that a plate appearance is different from an at-bat), whether that be via a hit, a walk, or a pitch. It does not include errors by the defensive team. However, it shows no difference between hitting a single or being nailed by a fastball to the midriff.
The size of the statistical number is mainly created from the players batting average. However, some players have incredible plate discipline or poor hitting skills, and they can catch up to their rivals by being patient at the plate. Juan Soto, for example, had a batting average of .275 but an on-base percentage of .410, which was third in the majors. Some players have a knack for leaving pitches that are off the plate and working the “count” in their favor; others have a seeming knack for getting hit by pitches, but either way, it all adds up.
Ranges
Elite – .390+
Excellent – .360 to .389
Good – .335 to .359
Average – .315 to .334
Below Average – .295 to .314
Poor – Below .295
2023 MLB League Leaders
Ronald Acuna Jr – .416
Shohei Ohtani – .412
Juan Soto – .410
Yandy Diaz – .410
Freddie Freeman – .410
Strongly Linked Background Stats: Sweet Spot Rate, Swing and Miss Rate, Walk Rate
What is On-Base Plus Slugging (OPS)?
As previously alluded to, this stat is used by the vast majority of baseball to get a basic view of hitting performance. It combines a hitter’s on-base percentage with their slugging percentage, two uniquely different skill sets that are key markers for scoring runs.
A balance of patience at the plate, a strong hit tool, and a power bat are rare in baseball. However, it’s interesting to note that five of the “elite” on-base percentages were in the top six for slugging percentage in 2023.
Ranges
Elite – .900+
Excellent – .810 to .899
Good – .750 to .809
Average – .690 to .749
Below Average – .650 to .689
Poor – Below .650
Anyone with an OPS of over 1.000 is likely to be in the thick of an MVP race, something both of this year’s MVPs (Ohtani and Acuna Jr) achieved. It’s almost become a prerequisite in recent seasons, although some have done it differently. You can use a strong hit tool to boost the floor of both your OBP and your slugging percentage, like Acuna Jr, or you can rip the ball out of the ballpark on a regular basis like Aaron Judge and Ohtani.
2023 MLB League Leaders
Shohei Ohtani – 1.066
Corey Seager – 1.013
Ronald Acuna Jr – 1.012
Matt Olson – .993
Mookie Betts – .987
OPS is far and away the most commonplace tool baseball fans use, and it provides as effective a summary as you could hope for. Measuring a hitter’s plate discipline (their ability to swing at balls only in the strike zone), their ability to make quality contact with the ball, and their ability to hit for those big extra-base hits regularly, OPS brings together all the key components that make a hitter effective into one statistic.
One key thing that requires OPS to be contextualized; it’s not adjusted for ballpark or era, which makes it useful for comparisons within the same year but often isn’t useful when comparing a player from the 1930s to a player in the 1990s.
Stolen Bases
In short, a stolen base is when a hitter tries to go from one base to the next (i.e., second base from first base) without the hitter doing anything in the batter’s box. Once a pitcher starts his throwing motion, he has to throw to the catcher, who then tries to throw to the base being stolen before the base runner reaches it. The plays are often split-second plays, with mere fractions deciding whether the base runner is safe and reached the base on time. Base stealing was on the wane for some time in the 2000s and 2010s due to analytics suggesting a player needed to be extraordinarily efficient (80%+ success rate) to add value this way.
Last season saw a real resurgence in stolen bases, with Ronald Acuna Jr., Esteury Ruiz, and Crobin Carroll taking advantage of some tweaks to the rulebook to take over 50 bases each this season (73, 67, and 54, respectively). Only two players since 2011 had surpassed the 50 steals mark, so it was a real show of speed that brought some excitement back to the game in these situations.
One of the most interesting things about 2023 was that it showed you don’t need to be a speed merchant to steal bases. Freddie Freeman used his baseball instincts to predict when a pitcher was throwing to gain an extra step, and despite an average sprint speed in the 34th percentile of baseball, he stole 23 bases last season.
Ranges
0 to 5 – Kind of slow
6 to 15 – Solid speed, but nothing to write home about
16 to 25 – A Good base stealer
26 to 40 – Almost elite speed; pitchers and catchers will be twitchy with them on base
41+ – Elite speed and base-stealing instincts
Base stealing is simply fun to watch and adds variety to the spectacle of baseball. Stealing second base and getting into “scoring position” is a fantastic way to create runs for your team, and it’s no surprise that with slightly friendlier rules, some teams are taking full advantage.
League Leaders
Ronald Acuna Jr – 73
Esteury Ruiz – 67
Corbin Carroll – 54
Bobby Wiit Jr – 49
CJ Abrams – 47
The Key Background Statistics
What are Hard Hit Rate and Average Exit Velocity?
Combining these two statistics is a fantastic way to determine which hitters are regularly making quality contact. As the name suggests, average exit velocity calculates the average speed at which a ball leaves a hitter’s bat. While it does tell you how regularly a hitter squares up the baseball, it is a good indicator of power.
Average Exit Velocity Ranges
Elite – 92+ mph
Excellent – 90.5 to 92 mph
Above average – 89 to 90.5 mph
Average – 87.5 to 89 mph
Below average – 86.5 to 87.5 mph
Poor – Below 86.5 mph
The stat on its own doesn’t always indicate a player’s ability to hit for extra bases, as hitting the ball hard into the ground will likely be stopped by the infield. However, alongside a hitter’s ground ball rate, it can be a strong background stat for both slugging percentage and batting average.
Hard hit rate calculates how often a player makes contact with a ball in play; they hit the ball harder than 95 mph. This is when hitting a ball harder begins to matter, as in 2018, hitters had a batting average of .524 on hard-hit balls while hitting just .219 on “weakly” hit balls. Hard hit rate has a strong correlation to batting average and slugging percentage, and combined with launch angle stats and average exit velocity, it is a very handy indicator of a player’s hitting performance.
Hard Hit Percentage Ranges
Elite – 52%+
Excellent – 48% to 52%
Above average – 45% to 48%
Average – 41% to 45%
Below Average – 38% to 41%
Poor – Below 38%
As a hitter, your objective at the plate is to hit the ball hard when you step up to the plate and let the rest take care of itself over the course of a long season. As such, these two stats are key markers that relate to actual on-field performance for hitters and are regularly used to assess both current ability and developmental potential.
What is a Player’s “Sweet Spot Rate”?
This calculation assesses how often a player hits a ball at optimum launch angles (from 8° to 32°). It is used in tandem with hard hit rate to assess whether the hitter is creating quality contact and reaching the outfield with regularity.
Sweet spot percentage has a huge correlation with batting average, even without considering how hard the balls are hit. Luis Arraez and Freddie Freeman, two of baseball’s perennial highest batting averages, led the league in 2023 in this stat. Arraez had an average exit velocity of 88.3 mph, so it’s clear that his sweet spot rate was a big factor in his momentous 2023 season.
It also has links with slugging, particularly when paired with exit velocity metrics. To get extra bases, the ball should fly into gaps in the outfield or clear the fence, which requires lifting the ball in the air.
Ranges
Elite – 40%+
Excellent – 37.5% to 40%
Above average – 36% to 37.5%
Average – 34% to 36%
Below Average – 32.5% to 34%
Poor – Below 32.5%
One outlier is the National League runner-up in batting average, Ronald Acuna Jr., whose 33.6% sweet spot rate was good enough for 80th out of 133 hitters in 2023. Acuna made up for this by hitting the ball harder than anyone and putting the ball in play at an absurd rate.
What is a Player’s “Barrel Percentage”?
Another statistical amalgamation, barrel rate, combines sweet spot rate and hard hit percentage to show how often a hitter hits a ball above 95 mph at optimum launch angles. It’s a stat geared toward hitting extra bases and closely aligned with slugging ability and projection. As the leading slugger in 2023, it’s no surprise to see Shohei Ohtani top the barrel rate with an astounding 19.6%.
Ranges
Elite – 16%+
Excellent – 12.5% to 16%
Above Average – 10.5% to 12.5%
Average – 8% to 10.5%
Below Average – 6% to 8%
Poor – Below 6%
The ability to hit the ball hard and aerially regularly is a difficult skill but indicative of a quality slugger. Hence, the leaderboard is filled with names like Jake Burger (3rd), Kyle Schwarber (4th), and Matt Olson (5th), all of whom are likely to be perennial 30-home-run hitters.
What is Weighted On-Base Average (wOBA)?
They are designed to measure a player’s overall contribution to run scoring by factoring in the run values of various events (e.g., a double is worth X, a single is worth Y, and a walk is worth Z) and averaging this value over a player’s plate appearances.
It sounds complicated, but essentially, this metric is supposed to assign a total value for the hitter offensively during the season and is a very solid statistic for doing so, given the data complexity behind it. All that really needs to be known is that wOBA cares not just about how you get on base but also how you get on base when assigning value.
Ranges
Elite – .400+
Excellent – .360 to .400
Above Average – .345 to .360
Average – .332 to .345
Below Average – .315 to .332
Poor – Below .320
2023 MLB League Leaders
Shohei Ohtani – .433
Ronald Acuna Jr – .428
Corey Seager – .419
Mookie Betts – .416
Matt Olson – .413
The top five hitters in WOBA are arguably the most dangerous in baseball in 2023, making it an accurate representation of hitting ability and a useful tool for assessing a player.
What is a “Whiff Rate”?
As you can imagine, how often a player swings and misses (or “whiffs”) is an excellent indicator of whether they strike out frequently and whether they are likely to have high batting averages and on-base percentages. The best four hitters at making contact are also players closely associated with winning or being future batting title winners.
Ranges
Elite – Under 15%
Excellent – 15% to 18.5%
Above Average – 18.5% to 22%
Average – 22% to 25%
Below Average – 25% to 28%
Poor – Above 28%
Usually, hitters with high contact rates have relatively short, flat swings that lend themselves to swinging later and with less torque, meaning they don’t hit the ball hard as often, reducing their slugging potential. The top five in 2023 are unlikely to ever be in contention for a home run crown:
2023 MLB League Leaders
Luis Arraez – 7.8%
Steven Kwan – 11.1%
Nico Hoerner – 12.4%
Jeff McNeil – 13.4%
Myles Straw – 14.0%
What is a Chase Rate?
Chase rates are the number of times a player will swing at a pitch outside the strike zone anyway. Making good contact is far easier inside the strike zone, so enticing a chase is extremely attractive to pitchers.
Chasing is often linked with more strikeouts and lower walk rates, making it harder to get on base. In contrast, players with good plate discipline can work the count in their favor, usually getting easier pitches to hit or taking a walk with more regularity if they don’t. Good chase rates have some correlation to good walk rates and better batting averages, but not as close as you may think. However, it’s still helpful in assessing whether a hitter is comfortable at the plate and has knowledge of their strike zone.
2023 MLB League Leaders
Mookie Betts – 16.6%
Juan Soto – 16.6%
Lars Nootbaar – 17.1%
LaMonte Wade Jr – 17.9%
Jack Suwinski – 18.2%
What are Expected Statistics (xBA, xSLG, xWOBA, etc)?
These use batted ball data to estimate the estimated outcome for a hitter based on simply how hard, how far, and what launch angle they hit the ball. This data is compared with data from previous years to estimate how likely a particular batted ball is to get a hit or what the likely outcome is.
The strengths of these statistics are in their simplicity; as I mentioned earlier, a hitter steps up to the plate to hit the ball as hard and as far through the air as possible in most cases, which these expected stats measure perfectly.
They do not account for customized fielding positions or the ball’s direction. This is vital given the outer edge of the outfield fence can be as short as 330ft, while dead center field is usually 400+ ft. So, to one part of the park, a 340 ft fly ball is a home run; to another part of the field, it’s a fly out. This all means that a hitter who goes up the center more often will likely have a higher set of expected stats than his actuals due to hitting into a larger area.
Over the course of a season, these expected numbers usually balance out to indicate whether a hitter was lucky or unlucky during the year.
These stats are particularly useful in predicting future outbreaks or slumps based on batted ball data and, ultimately, align well with what people see on the field.
The ranges used for each expected data point are usually contrasted with the players’ actual results and are in line with the actual statistics listed above.
At the end of 2023, they predicted that Cody Bellinger had a rather lucky season, with a batting average almost 40 points higher than estimated figures, meaning he could come back down to earth. Vladimir Guerrero Jr. and Pete Alonso were unlucky and could have expected batting averages 30 points higher than their actual figures.
What does Strikeout Percentage (K%) tell us?
How often a hitter strikes out can be down to extreme swing-and-miss problems, an overly patient approach at the plate, and sometimes a combination of the two. It’s pretty self-explanatory, so to the ranges:
Ranges
Elite – Below 12%
Excellent – 12% to 16%
Above Average – 16% to 19%
Average – 19% to 22%
Below Average – 22% to 24%
Poor – Below 24%
2023 MLB League Leaders
Luis Arraez – 5.5%
Jeff McNeil – 10%
Keibert Ruiz – 10.3%
Steven Kwan – 10.4%
Jose Ramirez – 10.6%
What does Walk Percentage (BB%) tell us?
Again, an obvious statistical measurement that plays heavily into on-base percentage, it can be a benefactor of an overly passive approach at the plate, which is why walk and strikeout rates are often put side by side when analyzing a hitter.
Ranges
Elite – Above 14%
Excellent – 11% to 14%
Above Average – 9.5% to 11%
Average – 8% to 9.5%
Below Average – 6.5% to 8%
Poor – Below 6.5%
2023 MLB League Leaders
Juan Soto – 18.6%
Kyle Schwarber – 17.5%
Shohei Ohtani – 15.2%
Max Muncy – 14.7%
Bryce Harper – 14.7%
Why Does Ground Ball Rate Matter?
Ground Balls have a lower expected batting average and slugging percentage compared with line drives, partly because hitting into the ground takes speed out of the ball and because you have to get through the infield rather than over it. As such, players with high ground ball rates can struggle to access high slugging numbers no matter how hard they hit it. Christian Yelich is a prime example of someone smacking the cover off the ball but too often hits it into the ground for his power to play up the way it should.
The league’s lowest ground ball hitters are Mookie Betts, Jack Suwinski, Cal Raleigh, Brent Rooker, and Max Muncy, all players who deal in damage with high slugging marks. On the other hand, Yandy Diaz, Christian Yelich, and William Contreras are all good at putting the ball in play. Still, while they can hit the ball hard, many experts believe they could take off power-wise should they find a way to elevate it with more regularity. Diaz alone hit .330 with 22 home runs last season despite the high ground ball rate.
What are OPS+ and WRC+?
Weighted Runs Created Plus (WRC+) and OPS+ are interesting stats as a basis for comparison because they assess a players total for each statistic as a comparison to the league and ballpark they are playing, with a “100” mark being league average, and a “120” mark being 20% above league average. Recent seasons involving numerous rule changes affecting the hitting environment and some parks considerably more hitter-friendly than their counterparts have become vital ways of ranking a hitter. A .900 OPS, as earlier mentioned, was considerably more common in 2004 than in 2022, meaning a .912 OPS by Hideki Matsui for the Yankees achieved a 137 OPS+. In contrast, Manny Machado in San Diego has an OPS of .898, good enough for a 157 OPS+. Machado was 57% better than the league average compared to Matsui’s 37%.
Weighted Runs Created is a statistic attempting to isolate the total offensive value a player provides their team, whether from hitting or running on the basepaths. It attempts to measure a player’s total offensive value in the form of runs and then weights that are compared to the league average. WRC+ has become a valuable tool as many heavy sluggers lose value on the basepaths. At the same time, the more fleet-footed athletes often struggle to create the power to clear fences with regularity, meaning both have ways to create runs using their talents. Running the basepaths doesn’t necessarily mean stealing bases; it can also mean avoiding double plays or reaching third base from first base when the hitter singles.
What is Isolated Power (ISO)?
Standing for Isolated Power, this stat is simply the slugging percentage less the batting average. It’s a handy tool when used with other statistics but not incredibly valuable. The most useful application is in hitters with extreme batting averages, with a high ISO demonstrating a hitter’s propensity to do damage when they hit their way on base. A standard measurement for this stat is that anything over .200 is a strong number.
What is K-BB%?
Many scouts review prospects using a combined stat comparing the number of strikeouts to the number of walks, and this ability translates well to the major leagues. Coming through the minor leagues, eyes are usually on players who walk as much as or more than they strike out, but in the major leagues, that would be considered elite. That would be considered average if a player walks 75% as much as he strikes out.
What does Solid Contact % mean?
It is not quite a barrel but constitutes a ball hit in the air and stuck well enough to have a reasonable chance at landing for a hit. Some players like Steven Kwan may not have the average exit velocities for regular barrels. However, they put the ball in the outfield dirt at a strong rate to make up for it. This is a handy stat for assessing players with a hit tool vastly outperforming their power tool.
Why does Pull/Center/Oppo % matter?
It splits up how often a player hits each third of the field. Pull-side dominant hitters are usually power players looking to clear the fences, but they have to swing slightly earlier and, as a result, can swing and miss more. Swinging to the opposite field allows you to swing later, often leading to a higher batting average. If you’ve heard commentators referring to “opposite field approach,” that’s why. It’s also an approach players tend to lock into more often in a two-strike count.
What Does a Percentile Exit Velocity Mean?
Some people move more away from average exit velocity on the assumption that whether a ball hits 90-95mph doesn’t make as much of a difference in hitting some balls 80mph and some 110mph. Modern baseball thinking prioritizes home runs, and extra-base hits significantly more than mere singles. As such, the ability to have a high 90th percentile exit velocity is considered a better evaluator than a 50th percentile (normal) average exit velocity. In reality, both could be used in tandem with each other, but it’s an extra tool that’s becoming more commonly referenced in today’s game, and the extra base effect is why.
Pitching Statistics
Table of Contents (click to jump to individual statistic)
- What Is ERA?
- What is a Good Strikeout Rate (K%)?
- What Is A Good Walk Rate?
- Whiff Rate
- Chase Rate
- Pitcher WHIP
- Movement Profiles
- BABIP
- Induced Vertical Break
- Vertical Approach Angle
- Pitcher Extension
- Release Point
There are two types of pitchers: Starting pitchers, who throw a large number of pitches each appearance and get four to five days off between starts, and relievers, who pitch more regularly but over far shorter periods. Relievers “relieve” the starting pitcher and finish the game, usually after the fifth or sixth innings. They are considered less valuable than a good starting pitcher because, amongst other reasons, they pitch fewer innings over the course of a season. That being said, both types add value in their ways, and having an effective bullpen of relievers is a big part of consistently winning baseball games. The difference between them is that they often have more pitching variations to throw because they’ll be facing the same hitter on two or even three different occasions.
Like hitters, pitchers have various ways of getting hitters out, whether blowing them away with unhittable stuff (which refers to a combination of pitch velocity and movement), manoeuvering them into uncomfortable positions to create weak content, or using pinpoint command to stay away from the barrel of the bat. These can all be successful methodologies in the big leagues, which means you need to be aware of a variety of statistics when assessing a player’s ability for their style of getting outs.
Basic Pitching Statistics
What is ERA?
An earned run average (ERA) attempts to credit a pitcher with the runs they are responsible for by totaling up all runs conceded while on the mound, removing those that scored due to fielding mistakes, and averaging it over a nine-inning span. A player with an ERA of four averages four “earned” runs conceded over nine innings. Elite relievers regularly hold lower ERAs than elite starting pitchers, but the ranges are similar for what one would consider an effective pitcher.
Ranges
Elite – 2.80 ERA and Below
Excellent – 2.81 ERA to 3.40 ERA
Above Average – 3.40 ERA to 3.80 ERA
Average – 3.81 ERA to 4.30 ERA
Below Average – 4.31 ERA to 4.80 ERA
Poor – Above 4.80 ERA
Another interesting part of this statistic is that a pitcher only gets credit for runners. He is allowed on base if they score. If a starting pitcher gets “relieved” with runners on first and second base and the reliever lets both men score, the starting pitcher gets credited with the runs allowed.
League Leaders (Starters Only)
Blake Snell – 2.25 ERA
Gerrit Cole – 2.63 ERA
Sonny Gray – 2.79 ERA
Kyle Bradish – 2.83 ERA
Kodai Senga – 2.98 ERA
What is a Good Strikeout Rate (K%)?
A strikeout rate establishes how often a hitter strikes out the opposing hitter. Strikeouts are a highly valued commodity in the baseball world as raw “stuff” will get outs no matter where you go, and as such, it is an accessible performance predictor. We’ve seen some gaudy totals late in this category, with pitchers getting nastier arsenals than ever. Strikeouts are a good indicator of ability as, in regards to the defensive team, the pitcher entirely controls them. Strikeouts also mean that hitters struggle to even make contact with the ball, and often lead to poorer contact rates when hitters do manage to hit the ball.
This measurement has overtaken the previous “strikeouts per nine” statistic because “K/9” could feature 27 strikeouts while giving up infinite hits and walks, whereas the strikeout rate avoids these anomalies altogether.
Ranges
Elite – 29% and above
Excellent – 27% to 29%
Above Average – 25% to 27%
Average – 23% to 25%
Below Average – 21% to 23%
Poor – Below 21%
League Leaders (Starting Pitchers)
Spencer Strider – 36.8%
Blake Snell – 31.5%
Kevin Gausman – 31.1%
Freddy Peralta – 30.9%
Pablo Lopez – 29.2%
Strongly Linked Background Statistics: Chase Rate, Whiff Rate
Strikeout percentage doesn’t provide quite enough information, but it does provide a good measure of a player’s raw stuff. As mentioned earlier, the ability to miss bats is key to long-term success at the major league level for most. The other element is your ability to command your pitches, which means locating them inside the zone when you want to and to different parts of the zone when you want to, which may lead to your next question…
What Is A Good Walk Rate?
Often used as a gauge of command, it doesn’t quite tell how effective a player is at hitting his spots inside the zone, but walks per nine innings does tell you if a pitcher can be wayward at times. Some recent Cy Youngs (notably Blake Snell in 2023) have flirted with this statistic, lending some belief that walks aren’t quite as damaging as they used to be in today’s era of nasty pitching stuff, however for the vast majority not walking hitters and finding the strike zone with regularity generally lends itself well to prolonged success over the course of a season.
Similarly to strikeout rate, walks per nine (BB/9) has been slowly phased out in recent years as a result of the percentages being less prone to anomalies, in that a hitter may face (hypothetically) 100 hitters and give up just three walks, which is three walks per nine (average) but is actually an elite 3% walk rate per hitter.
Ranges
Elite – Below 4%
Excellent – 4% to 5.5%
Above Average – 5.5% to 7%
Average – 7% to 8%
Below Average – 8% to 9%
Poor – Above 9%
League Leaders (Starting Pitchers)
George Kirby – 2.5%
Zach Eflin – 3.4%
Logan Webb – 3.6%
Miles Mikolas – 4.5%
Logan Gilbert – 4.7%
Usually, a combination of walks rate and strikeout rate will give a good feel for the truly elite pitchers, with the pitching arsenal to miss bats while also locating the strike zone at a strong clip that forces hitters to hit their way on base. Not every successful pitcher follows this model, but it’s one reason why Corbin Burnes and Gerrit Cole have been so successful in their recent Cy Young Seasons.
How is Fielder Independent Pitching (FIP) different from ERA?
Fielder Independent Pitching (or FIP) is an attempt to quantify a pitcher’s performance by taking fielders almost entirely out of it, measuring them based on walks, strikeouts, home runs, and infield fly balls (which are virtually guaranteed outs). In doing so, they remove any of the plays made by fielders and have proven over a strong sample size to be a good indicator of a pitcher’s ability.
Due to the relative lack of sources its results are based on, it should be treated as an addendum to ERA rather than a replacement for it, and it’s important to see that it doesn’t assist in analyzing the more canny pitchers, who rely on creating soft contact instead of striking out hitters. They can be more volatile as a result, but pitchers like Wade Miley or Kyle Hendricks just aren’t assessed fairly by this statistic, no matter how few walks they issue.
Ranges
Elite – 3.00 and Below
Excellent – 3.00 to 3.40
Above Average – 3.40 to 3.80
Average – 3.81 to 4.30
Below Average – 4.31 to 4.80
Poor – Above 4.80
League Leaders
Sonny Gray – 2.83 FIP
Spencer Strider – 2.85 FIP
Kevin Gausman – 2.97 FIP
Zach Eflin – 3.01 FIP
Justin Steele – 3.02 FIP
The Key Background Statistics
What is a “Whiff” Rate?
A pitcher’s whiff rate refers to the percentage of opposing hitters that swing and miss the ball entirely. It’s a strong indicator of good movement and velocity on their pitches, which leads to good strikeout rates. Striking out a hitter is the best way to guarantee an out, and is highly coveted by baseball teams. It also bears a correlation to more weak contact at the edges of the bat, usually leading to outs in that way too.
Certain pitch types are more likely to get swings and miss than others, with a four-seam fastball usually more efficient here than a two-seamer (or sinker), the addendum being that because hitters hit fewer ground balls on a four-seam fastball, it can lead to more home runs. For some pitchers, such as Spencer Strider or Freddy Peralta, this statistic is vital to how they perform, whereas for others, like Sandy Alcantara, it’s less important.
Ranges
Elite – Above 35%
Excellent – 30% to 35%
Above Average – 27% to 30%
Average – 24% to 27%
Below Average – 22% to 24%
Poor – Below 22%
League Leaders (Starting Pitchers)
Spencer Strider – 38.6%
Blake Snell – 37.3%
Tyler Glasgow – 35.2%
Freddy Peralta – 33.6%
Shane McLanaghan – 33.4%
Whiff rate is used a lot by scouts and analysts as a predictive tool to highlight a pitcher’s potential (or lack of). As such, it’s a valuable tool in your arsenal to make your mind up about a pitcher. However, there is a gap in its capability, as mentioned above; some pitchers rely on slight movements on their pitches, alongside elite command, to get weak contact on a regular basis for their fielding unit. These pitchers rarely grade out well in whiff rate but can be incredibly valuable to their teams. Wade Miley, for example, had an 18.8% whiff rate, 8th lowest among pitchers with 400 plate appearances in baseball., yet he also had a 3.14 ERA that was up with the elite baseball pitchers because he excels at generating weak contact.
What are Chase Rates?
Chase rates are a percentage value of the number of times a hitter swings at a pitch that isn’t in the strike zone. A hitter with a lot of movement on their pitches or high velocity can often entice more chases than a league-average arm, making it a quality statistic for evaluating a pitcher’s raw stuff. Batting averages and other statistics drop off significantly when the ball is outside the strike zone, so encouraging more swings on these pitches is incredibly advantageous for the pitcher. High chase rates often bear a lot of correlation to high strikeout numbers.
Ranges
Elite – 33% and Above
Excellent – 31% to 33%
Above Average – 29% to 31%
Average – 27% to 29%
Below Average – 25% to 27%
Poor – Below 25%
League Leaders
Sandy Alcantara – 34.8%
Aaron Nola – 34.7%
Spencer Strider – 34.3%
Pablo Lopez – 34.3%
Zach Eflin – 34.0%
One interesting note about the league leaders would be that Sandy Alcantara is a workhorse who prides himself more on weak contact than high strikeout numbers because it allows him to get hitters out faster and therefore work deeper into games as a starting pitcher. He uses his high chase rates not so much to generate swing and miss but to get weakly hit ground balls and let the defense behind him gobble up the scraps. That being said, Lopez, Strider, and Nola all racked up a lot of strikeouts in 2023, meaning that high chase rates are advantageous to a variety of successful pitchers.
strong>What is a Pitcher’s “WHIP”?
WHIP stands for “Walks and hits per inning pitched” and is a very valuable backup statistic for one simple reason: over the course of a 162-game season, the more traffic a pitcher sees on the bases, the more likely he is to give up runs. A home run is worth just one run if there’s no one on base. The best pitchers in the league, time and time again, have the best WHIP statistics, and it’s something front offices rely heavily on as an indicator. It’s one reason why pitchers who walk a lot of batters don’t get those big contracts (such as Blake Snell). With a limited sample size, it’s a fantastic indicator of future results and definitely something you should keep an eye on in your favorite team.
It does have a couple of issues in that it doesn’t include hit-by-pitches as part of the calculations. JP Sears of the Oakland A’s would have seen his WHIP jump from 1.26 up to 1.37, and some of the wilder pitchers would be more prone to this. More importantly, however, it doesn’t quantify the extra bases these hits give up or the situational aspect. A walk with the bases loaded, or a single with a runner in scoring position, is far more damaging. In the end, despite all the underlying complexities of how we rank pitchers, baseball is as simple as runs scored vs runs given up.
Ranges
Elite – Below 1.05
Excellent – 1.05 to 1.12
Above Average – 1.12 to 1.20
Average – 1.20 to 1.30
Below Average – 1.30 to 1.40
Poor – Above 1.40
League Leaders
Gerrit Cole – 0.98 WHIP
Zach Eflin – 1.02 WHIP
George Kirby – 1.04 WHIP
Kyle Bradish – 1.04 WHIP
Shohei Ohtani – 1.06 WHIP
What Movement Profiles Should You Look For?
A movement profile is a term used to describe the way in which a pitch moves through the air off of a straight path. However, it can be confusing because each pitch ideally moves in different ways. As such, here’s what you should look for when talking about each of these pitches, as well as where they are often thrown in the zone:
- Four-seam fastballs have backspin which creates an odd effect of fighting against gravity which is often called the “magnus effect.” This creates a rising effect that you will sometimes hear mentioned, and works best when thrown at high velocity up in the strike zone.
- Sliders are the most common “breaking” pitch thrown; for right-handed pitchers, to a right-handed hitter, they will move down and away from the hitter. They function best with late diving action on them and move both horizontally and vertically away from the hitter for maximum effect. They are best thrown where their movement goes, down and away from the zone. Sliders (or any off-speed/breaking pitch) that’s left up in the strike zone are referred to as “hanging” and are much easier to hit and hit hard.
- Changeups/splitters are usually characterized by low spin rates, looking like a fastball, but the low spin and finger placement slow down the pitch. It is often used for opposite-handed hitters (i.e., a right-handed pitcher to a left-handed hitter) as the movement profile, in that case, makes it tail down and away from the hitter. The lack of spin is something to look out for; less spin means more movement, and it can be a difficult pitch to develop, but the change in speed can make it very effective. Again, it’s best located down in the zone.
- Curveballs are the other common breaking pitch, and there are multiple variations of them in 12-6 (referencing the arms of a clock) or hammer curves. In terms of spin rates, anything over 3,000 RPM on average is considered elite. Curveballs are paired well with rising four seam fastballs, with extreme vertical drop they are best located down in the strike zone.
- Sinkers, or two-seamers, have a slightly different grip to four-seam fastballs and present a markedly different pitch with downward and horizontal movement that would move towards same-handed hitters. Pitchers usually attempt to keep them down in the zone and encourage hitters to swing over the top of them, creating a lot of ground balls for their defense.
- Sweepers are a variation of the slider that prioritizes horizontal sweeping movement over the vertical drop a traditional slider creates. They are used most effectively against same-handed hitters, curving violently away from the strike zone, and are best located on the outer edge of the strike zone in this case.
- Cutters are the other common fastball variation, trading a little bit of velocity in most cases but moving opposite to a sinker, going away from same-handed hitters. Again, they work best down in the strike zone, though they can play up almost anywhere due to the movement away from the hitter.
There are other lesser-used pitches such as screwballs, the eephus, forkballs, slurves, etc. but the main arsenals of MLB players consists of those listed above.
Here are the pitch locations from 2023 for left-hander Wade Miley (the view on the diagrams below is from behind the plate), which will hopefully give an idea of where pitchers want to throw more often than not. As you can see, the cutter went away from left-handed hitters, our seam fastball was mostly high in the strike zone, and his changeup went away from the right-handers.

What Does “BABIP” Mean?
A hitter’s or pitcher’s Batting Average on Balls In Play (or BABIP) is used as a means to see how fortunate or unfortunate that player has been in a certain time period. As a hitter, the end goal usually constitutes hitting a ball hard and in the air, but you could be unfortunate and find a fielder more often than others, which is what BABIP will tell you. It’s the batting average of a hitter/pitcher when you remove strikeouts and home runs, only taking into account balls that land in the field of play.
This is a high-level statistic and can be manipulated by several factors. Some pitchers are more likely to give up ground balls than fly balls, and the expected outcome of each would be vastly different, especially when removing home runs. It also doesn’t include the speed of the hitter, with Daniel Vogelbach far less likely to reach first base on a ground ball compared to Bobby Witt Jr. It also helps to have a high-quality defense behind you to make plays compared to a below-average one.
It also doesn’t account for how well a pitcher generates sub-optimal contact on their pitches, and for that reason, it’s not a surprise to see some excellent pitchers filling the top five in BABIP.
Ranges
Very Lucky – Below .260
Slightly Fortunate – .260 to .280
Average – .280 to .300
Slightly Unlucky – .300 to .320
Very Unlucky – .320 to .340
Which Deity Have You Upset – Above .340
Luckiest Pitchers
Corbin Burnes – .244
Jordan Lyles – .256
Blake Snell – .256
Gerrit Cole – .263
Justin Verlander – .265
The Modern-Day Pitching Statistics
As with everything, analysis develops over time, becoming more detailed and finding more patterns that can help ascertain just how good a player is, dialing into what makes a fastball effective, what makes a batter swing and miss, what presents an issue as the competition improves through the levels of the minor leagues. Of late, several statistics have come into the light that focus on what makes a fastball effective, and these relate to how a pitch defies gravity.
Think of it like this: if someone lobs a tennis ball to you from five yards away, your brain will calculate from past experience where that ball is likely to be and where your hands should go to catch the ball. This calculation includes an idea of how gravity will make the ball drop.The two statistics below are ways to see how well a four-seam fastball can resist gravity and stay “up” for longer, causing hitters to swing underneath the ball.
What Does Induced Vertical Break (IVB) Mean?
In an era when fastball velocity was considered the be-all and end-all of the pitch, it used to flummox fans how hitters would swing and miss with regularity at slower fastballs. Induced Vertical Break has been spoken about for the last few years as a new metric to explain this, with high spin rates causing a magnus effect that makes the ball appear as if it’s rising (hence the term “rising fastball”).
The ball is still affected by gravity, but to a hitter’s eyes, it appears as though it hovers longer than it should, which causes the hitter to swing underneath the ball. IVB is most effective when thrown high up in the strike zone or above the zone, where it plays havoc with the hitter’s eyes, and has led an effort to maximize both the spin and spin efficiency on pitches to enhance this rising effect. You’ll see with the leaders below how a large IVB bears a big correlation to a successful four-seam fastball. It is important to note that it can be harder to get higher movement with higher velocity, as a high spin rate will have more effect on a slow pitch than a faster one.
Ranges
Elite – 18.0” and Above
Excellent – 17” to 18”
Above Average – 16” – 17”
Average – 15.0” to 16”
Below Average – 14” to 15”
Poor – Below 14”
League Leaders (150 Innings Pitched)
Justin Verlander – 19.1”
Cristian Javier – 18.9”
Dylan Cease – 18.8”
Blake Snell – 18.5”
Spencer Strider – 18.0”
Each of the above names is known for a dominant fastball, regardless of the speed at which they throw it; showing IVB is a very valuable statistic in measuring the potential of a four-seam fastball in the big leagues.
Why Does A Vertical Approach Angle (VAA) Do?
Vertical Approach Angle is the next step on from induced vertical break, looking at what angle the pitch enters the strike zone at. Trying to further classify that “rising fastball” by taking in the induced vertical break alongside the angles a pitch is thrown from and a variety of other factors to quantify how deceptive the fastball is, VAA has found an even stronger correlation than IVB with fastballs that play better than their velocities indicate. Pitches closest to 0° or “flat” as they enter the strike zone cause more swing and misses on fastballs than those with a more downward trajectory. On top of in-zone swing and misses, it also directly affects how often hitters will chase pitches above the strike zone because of that hovering effect, with the hitter’s brain naturally anticipating gravity to have a bigger impact than it actually does.
It’s a very new stat, arriving in the public sphere from September 2023, and again has a very distinct link to hitters swinging and missing at pitches up in the strike zone. Here are the league leaders in VAA with over 120 innings pitched compared with the average velocities and the whiff rate against their four-seam fastballs (note that a “minus” indicates the ball is dropping as it reaches the strike zone, as nearly all pitches are)
League Leaders (120 Innings Pitched)
Joe Ryan: -3.83° VAA, 92.3 mph average, 28.7% Whiff Rate
Freddy Peralta: -3.88° VAA, 94.4 mph average, 29.2% Whiff Rate
Andrew Heaney: -3.94° VAA, 92.5 mph Average, 25.6% Whiff Rate
Luis Castillo: -4.00° VAA, 96.3 mph average, 33.0% Whiff Rate
So why is there such a fuss around VAA? Well, if we take Freddy Peralta and Luis Castillo’s four-seam fastballs, they both have elite whiff rates and low VAAs and yet they have induced vertical breaks of 15.2” and 14”, respectively, which would grade out as average and poor. Thus, it’s clear that IVB can’t cover the reasons for fastballs’ deceptive quality in totality but the vertical approach angle does explain how these two pitchers have been so successful behind their primary offerings, making it of extra statistical relevance. When looking up prospects in the minors, a low VAA should be considered a real weapon when they reach the big leagues. In an ideal world, a combination of both induced vertical break and vertical approach angle would be ideal, with anyone elite in either category suggesting that they could be highly effective if used correctly.
Ranges (on four-seam fastballs)
Elite: Above -4.10°
Excellent: -4.10° to -4.40°
Above Average: -4.40° to -4.60°
Average: -4.60° to -4.90°
Below Average: -4.90° to -5.10°
Poor: Below -5.10°
Other Pitching Statistics
How Does Extension Help a Pitcher?
Let’s face it: not everyone can throw 100 mph fastballs on repeat like some these days, but good extension off the mound can bridge the gap somewhat. A pitcher must begin their motion 60 ft and 6 inches from the hitter, but by striding forwards in their throwing motion, they can generate both momentum and close the gap to the hitter. The extension is measured by how far from the mound a pitch is released at, with the theory being that releasing the ball closer to the batter’s box decreases the amount of time they have to react to the incoming pitch.
Some shorter pitches would stand out in this category, but overall, it gives a big boost to the taller pitchers whose stride is that much greater than their more minute counterparts. The generally accepted rule is that a pitcher’s “perceived velocity” will increase by 1.7 mph for every extra foot of extension off the mound.
Ranges
Elite – Above 7.4 ft
Excellent – 7.0 ft to 7.4 ft
Above Average – 6.6 ft to 7.0 ft
Average – 6.3 ft to 6.6 ft
Below Average – 5.9 ft to 6.3 ft
Poor – Below 5.9 ft
League Leaders
Devin Williams – 7.7 ft
Alexis Diaz – 7.7 ft
Garret Whitlock – 7.6 ft
Jordan Romano – 7.5 ft
Logan Gilbert – 7.5 ft
How Does the “Release Point” Help A Pitcher?
As with most athletes, while technical fundamentals remain mostly the same from player to player, the outlying components can be quite different (such as watching Roger Federer and Rafael Nadal hit a forehand in tennis). In baseball, this can be something to celebrate, with pitchers throwing from different locations that make each a quite unique challenge for hitters. The average major league pitcher threw the ball from one foot eleven inches horizontally away from the mound and five feet nine inches vertically from the ground. Amongst this are a great variety of pitchers, from “submarine” arms who throw from barely a foot off the ground to players throwing wide of their body and enhancing the angle with which it arrives at the plate.
Each unique arm brings its own strengths and limitations, so you’ll often find that the better pitching staffs have a great array of techniques amongst them, allowing them to match up effectively to varying hitters.
Fielding Statistics
Table of Contents (click to jump to individual statistic)
Fielding metrics have become more precise over the last five years or so, based on old-fashioned fielding percentages, in an effort to bring fielding ratings in line with what the eye test suggested. Statistics such as Outs Above Average (OAA), Defensive Runs Saved (DRS), and Ultimate Zone Rating (UZR) attempt to include a player’s range, arm strength, and throwing accuracy in their rankings. They manage to fill in the gaps that the eye test fails in as well, in that if you’re watching a player make diving plays all the time, he may look sensational, while other players with better range will make those same plays without needing to sprawl out.
The Analytical Defensive Statistics
How Does Outs Above Average (OAA) Work?
Outs Above Average attempts to quantify the value of an “out” and has different metrics for infielders and outfielders, given they have very different requirements. They use a catch probability based on the distance a player has to run, exit velocity, launch angle, and direction of running to work out how likely an outfielder is to make a catch. Say, for example, a catch has a 40% probability of being made; if the defender succeeds, he gets +0.6 points; if he fails, he loses -0.4 points. Over the course of a season, the sheer volume of events provides a reliable assessment of the most valuable fielders. Statcast measures the outfielder’s time to the ball and can break it down by their reaction time, initial jump (i.e. their first few steps), and how efficient their route is to the ball.
Infielders require different data points, using the distance a defender has to travel to the ball, the distance they must throw to the base the hitter is running to, and also takes into account the positioning of the infielder, which is vital in today’s game, with defensive setup changing from one hitter to the next. Statcast also tries to quantify in which directions a player moves best and pick if they struggle with reads or movement either laterally or vertically. As you can see below in the league leaders, outs above average believe infielders have a greater probability of defensively affecting the game.
Ranges
Elite – Above 15
Excellent – 12 to 15
Above Average – 9 to 15
Average – 4 to 9
Below Average – 0 to 4
Poor – Below 0
League Leaders
Dansby Swanson – 20 OAA
Andres Gimenez – 18 OAA
Ke’Bryan Hayes – 17 OAA
Willy Adames – 16 OAA
Ezequiel Tovar – 16 OAA
What is Defensive Runs Saved (DRS), And How Does It Differ From OAA?
Defensive Runs Saved uses a different premise for calculating a defender’s ability, using runs instead of merely outs. They calculate the “runs saved” in a variety of situations, including bunts, double plays, defensive arm runs, and, most importantly, “rPM,” which assesses a fielder’s range and ability to convert a batted ball into an out. It’s a complicated measurement, as quantifying whether a run is actually saved would require knowledge of all possible future events, but it has proven exceptionally effective in rating defensive abilities.
One flaw is that, unlike OAA, DRS does not adjust for positional adjustments by the defenders and merely sees the likelihood of plays being made as if the defender is in a neutral position. For teams that like to tinker with their setups, this can be detrimental to the overall rating applied to the player. On the other hand, as previously mentioned, baseball comes down to runs scored vs runs conceded, and DRS does a better job of this than outs above average. A great catch with no one on base compared to when the bases are loaded has markedly different effects on the game, but whether that scenario is under the control of the defender potentially shouldn’t factor into their overall evaluation.
Created and found in the fielding bible, both DRS and OAA would have similar rankings in the eyes of professionals and the public for their quality of assessments. It doesn’t apply any positional boosts/penalties; instead, it simply compares players only to their own positions. By that note, a first baseman could end up with a higher DRS than a shortstop, but that’s not to say they’re a more valuable defensive player, given the sheer volume of difficult plays an average shortstop would have to deal with.
Ranges (Without Positional Adjustments)
Elite – 15+ DRS
Excellent – 10 to 15 DRS
Above Average – 5 to 10 DRS
Average – 0 to 5 DRS
Below Average – 0 to -5 DRS
Poor – Below -5 DRS
League Leaders (Without Positional Adjustments)
Daulton Varsho – 29 DRS
Fernando Tatis Jr – 27 DRS
Andres Gimenez – 23 DRS
Ke’Bryan Hayes – 21 DRS
Gabriel Moreno – 20 DRS
As you can see, there is a greater variety of positions leading the way with DRS in comparison to OAA, with a center fielder, right fielder, second base, third base, and catcher represented in the top five. Whether that makes it a better judge of ability is up for interpretation, though there are positional adjustments like UZR would use (see below) when factoring DRS into WAR calculations.
What is Ultimate Zone Rating (UZR) And How Does It Compare?
Ultimate Zone rating is perhaps the easiest metric to understand. Statcast data assesses similar plays made previously in terms of location, exit velocity, etc., to see how much better or worse this fielder did than previous fielders had managed. Like DRS, it bases the aforementioned expected success rates on the fielder being in a neutral position, so any form of shifting may come at a cost to the defender.
Essentially, UZR divides the baseball field into a multitude of zones and assigns each fielding position responsibility for its own set of zones, hence where the rigidity comes from. This may even out over the course of a season with the funky starting positions benefiting and hindering at various times over 162 games but it can impinge on the accuracy of the fielder and penalize or reward them unjustly. They also use errors and double-play runs saved to enhance their model’s accuracy.
UZR also attempts to put a run value to defense instead of comparing players only with others in their position, just like DRS would do. Then, they add a set “positional adjustment” (as can DRS) depending on the position played to give a true reflection of the value of the player’s defense. The flat rates are as follows for a full season of games:
Catcher: +12.5
First Base: -12.5
Second Base: +2.5
Third Base: +2.5
Shortstop: +7.5
Left Field: -7.5
Center Field: +2.5
Right Field: -7.5
DH: -17.5
This should also help provide some vague idea of the most valuable defensive positions in baseball, but the positional adjustments are mostly used to better convert the defensive abilities into WAR numbers.
Ranges (Without Positional Adjustments)
Elite: 12+ UZR
Excellent: 8 to 12 UZR
Above Average: 2 to 8 UZR
Average: -2 to 2 UZR
Below Average: -2 to -8 UZR
Poor: Below -8 UZR
League Leaders (UZR/150)
Brenton Doyle – 24.0 UZR
Fernando Tatis Jr – 17.2 UZR
Ian Happ – 11.4 UZR
Alex Verdugo – 10.5 UZR
Austin Hays – 8.1 UZR
The list of league leaders is quite helter-skelter and not particularly in line with the sentiment of baseball experts. Although they attempt to quantify things similarly to DRS, the end results show a large disparity, which results in it being a less highly regarded statistic in comparison to OAA and DRS.
The Other Fielding Statistics
Fielding Percentage
Fielding percentage is the most basic fielding stat out there, and it used to be the be-all and end-all of fielding metrics. It tries to see how many errors a player commits, calculated as (putouts + assists)/(putouts + assists + errors). There are some big issues with this. However, one is that it is up to one scorer to decide the fine line between an error and a difficult, unlikely play. Scorers are renowned for almost never assigning an error to an outfielder for misreading balls in the air.
The other is that it does not account for range. Imagine you have two athletes, one weighing 350 lbs and the other weighing 200 lbs; the 350-lb behemoth has a ball hit right at him, which he bobbles and makes an error on, while the 200-lb man covers 5 yards in no time to make a great play but bobbles the ball and is ruled an error. Both of these are scored the same way, but it would be entirely unfair to rate them as equal defenders.
Finally, throwing errors can often be a combination of two parts. Most first basemen can scoop balls that bounce in front of them, but a poor first baseman can make mistakes that charge his teammate with a throwing error. Baseball is a team sport, and sometimes errors just aren’t the correct way to measure defensive ability.
That being said, one thing fielding percentages (as well as regular error counts) will do is show up high error totals. Juan Baez of the Brewers minor league system in 2023 had 12 errors in just 72 chances at shortstop for the ACL Brewers, an error once every six attempts, which is wholly unplayable at any level, no matter how you frame it.
Catcher Defensive Statistics
Table of Contents (click to jump to individual statistic)
Catchers are the most important defensive players on the field, relied heavily upon to call the pitches and manage the game while stopping pitches from getting past them and trying to catch and “frame” pitches so that they appear more like a strike to the umpire. On top of all this, they need incredibly strong arms and quick reaction times to throw out would-be base stealers. Catching is a hard grind of a job, but those who do it well get recognition far beyond what their WAR totals can show. Statcast has come up with several measurements over the last few years that give a far better indication of the position’s defensive influence. However, calling games is still assessed based on reputation and rumor rather than any measurable statistic.
What Do Pitch Framing Metrics Tell Us?
The area just outside the strike zone is called the “shadow,” and it’s an area where many catchers try to fool umpires into believing the pitch is inside the zone. Statcast has recently come along with a tool that allows us to see how often a catcher is able to fool the umpire in each of these zones:

Most catchers are stronger in some areas than others, favoring one side over the other, but regardless, this skill can be incredibly beneficial to the pitching staff by making their strike zone larger. Statcast then went on to quantify how many runs this would have saved their team on average over the course of a season.
Ranges
Elite: Above 49%
Excellent: 48% to 49%
Above Average: 47% to 48%
Average: 46% to 47%
Below Average: 45% to 46%
Poor: Below 45%
The difference between an average arm and the elite 52.9% from Patrick Bailey in 2023 was estimated at a whopping 16 defensive runs.
League Leaders
Patrick Bailey – 52.9%
Austin Hedges – 52.5%
Cam Gallgher – 51.2%
Jose Trevino – 49.9%
Seby Zavala – 49.9%
How Valuable Is (Blocks Above Average) For A Catcher?
Blocks Above Average reviews how often a catcher stops a difficult pitch from getting past them and the number of runs this saves over the course of the season. A more miniscule form of defensive run prevention, it is nevertheless essential in preventing runners on the basepaths from advancing cheaply. Taking the league leader in Blocks Above Average (BAA), it was estimated that they saved just four defensive runs over the season, which shows how much more valuable defensive framing is.
Ranges
Elite: Above 12 BAA
Excellent: 7 to12 BAA
Above Average: 2 to 7 BAA
Average: -2 to 2 BAA
Below Average: -2 to -6 BAA
Poor: Below -6 BAA
League Leaders
Sean Murphy: 16 BAA
Alejandro Kirk: 14BAA
Nick Fortes: 13 BAA
J.T. Realmuto: 12 BAA
Gabriel Moreno: 10 BAA
What Is “Pop Time” For A Catcher?
Perhaps the most vital part of controlling base stealers, pop time measures how quickly, on average, a catcher can receive the ball, set their feet, and throw the ball to second base. It’s measured as the time from the point of receiving the pitch to the moment the infielder catches the ball. In calculating this, it’s important to differentiate between players stealing second base and players stealing third base. Third base is closer to the catcher, and therefore, pop times will be lower, while most steals happen at second base, and it’s the pop times most people would quote and focus on.
Pop time as a statistic is more valuable than a caught stealing percentage simply because it isolates the catcher’s involvement and removes the speed of the incoming pitch (slow breaking pitches are easier to steal on for obvious reasons) and the tagging ability of the infielder receiving the ball. The one thing it doesn’t do is include a wayward throw, so if the infielder has to stretch or dive, this may cause them to miss the runner but isn’t assessed as part of pop times.
Ranges (to Second Base)
Elite: Under 1.90 seconds
Excellent: 1.90 to 1.94 seconds
Above Average: 1.94 to 1.96 seconds
Average: 1.96 to 1.98 seconds
Below Average: 1.98 seconds to 2.01 seconds
Poor: Above 2.10 seconds
League Leaders (to second base)
J.T. Realmuto – 1.83 seconds
Christian Bethancourt – 1.87 seconds
Patrick Bailey – 1.87 seconds
Yainer Diaz – 1.90 seconds
Gabriel Moreno – 1.90 seconds
While catching is made up of various components, framing is the most valuable quantifiable statistic for their defensive impact due to the large number of occasions in which their framing skills are used. A pitcher may only get 40-50 attempts to catch a runner stealing a base but will receive thousands of pitches over the course of a season. Patrick Bailey, despite having a 9th-percentile Blocks Above Average rate. Gabriel Moreno had a more varied ability, being slightly below average in framing but in the upper echelons of both Blocks Above Average and pop times that resulted in him catching nine more base stealers than your average catcher. Then you have J.T. Realmuto, who was elite both in blocks above average and had the best pop times in the league but was one of the worst framers in baseball and produced negative defensive value on the season. The long and short of it is that you don’t have to be the best framer to be a strong defensive catcher, but you definitely can’t be the worst framer.


Leave a comment